Pittsburgh Regional Transit’s attempt to rebuild its ridership after the pandemic is leveling off, and the agency continues to lag behind comparable agencies across the country in key areas such as cost, on-time performance and time in revenue-producing service.
Those are the major conclusions of the agency’s annual service report for the fiscal year that ended June 30. The 42-page report was presented to the board’s planning and stakeholder relations committee Thursday.
Ellie Newman, assistant director for planning and service, told the committee that overall ridership increased 17.3% to 36,981,781. That follows a 42.6% increase the previous year and is a strong sign that ridership is leveling off after a low of just over 22 million in fiscal year 2021, the first full year of the pandemic.
Overall, ridership is 57.3% of what it was before the pandemic, when it reached a peak of more than 66 million in 2019.
Bus ridership increased 16% last year, light rail 48% and ACCESS paratransit 10%. The light rail increase was particularly encouraging because ridership there has been slower to recover.
Ridership on the Monongahela Incline between Station Square and Mount Washington was down 52% because the funicular was closed about six months for refurbishing.
In an interview after the committee meeting, CEO Katharine Eagan Kelleman said the ridership numbers reflect new work standards that developed during the pandemic, where more office workers have a mixed schedule of reporting to the office some days and working from home others. Ridership will not return to pre-pandemic levels any time soon, she said.
“We’re pretty confident we’re seeing what we are going to see,” she said.
To deal with that situation, the agency already has started a complete redesign of its 91 bus routes, many of which haven’t been substantially changed in more than 40 years. The multiyear study is expected to recommend new paths for many buses to reflect changing housing patterns throughout Allegheny County.
It also is expected to identify new areas that should have transit service.
In addition, following recommendations in the agency’s 25-year NEXTransit plan, the study will identify a series of shorter routes the system should establish so that riders can go from one neighboring community to another without traveling to Downtown Pittsburgh to transfer. That also will provide a feeder system to get suburban riders to main routes where they can transfer to get into the city if that is their final destination.

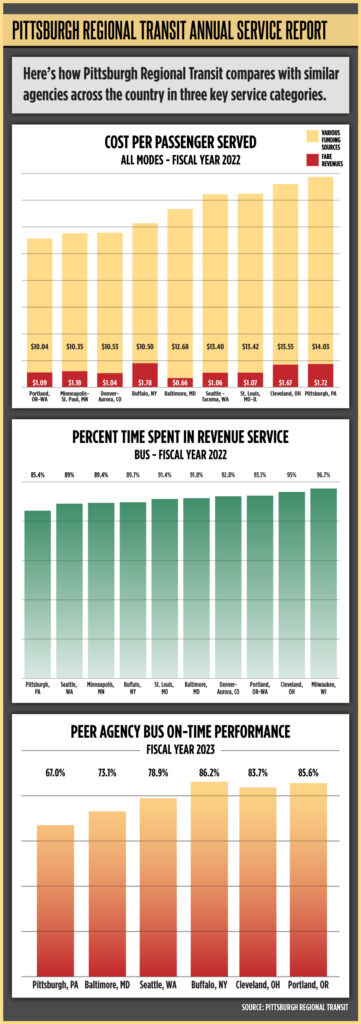
The study also continues the agency’s pattern of not comparing well to similar transit operations across the country.
For example, compared to nine colleagues, PRT’s cost per passenger is the highest at $15.75, just ahead of Cleveland at $15.22. The lowest is Portland, Ore., at $11.13.
Those figures are for fiscal year 2022, the most recent available.
Broken down further, the biggest factor is PRT’s light rail service, which costs $33.52 per rider, nearly double the rate of second place Baltimore at $18.10. PRT attributes the high cost of light rail service to the agency taking over the old streetcar system in Pittsburgh’s South Hills in the 1960s and not being able to modernize much of the infrastructure.
Bus service here is the fourth highest cost at $11.86, with St. Louis the leader at $12.96.
The agency also is the worst among its peers in the time it spends serving passengers and on-time performance.
Figures for fiscal year 2022 show PRT bus drivers spend more time getting from garages to their service areas than their peers. Local drivers spend 85.4% of time in passenger service, last compared to Milwaukee’s best at 96.7%.
For several years, the agency has recognized the need for a fifth maintenance garage to have buses closer to their routes, but a new garage would cost more than $200 million.
The agency’s on-time performance for the year that ended June 30 — more recent figures than the other comparisons — also was the worst compared to five peers. PRT was on time — one minute early to five minutes late — only 67% of the time while Portland was best at 85.6%.
PRT’s goal is 75% on-time service and its average was 71% for the previous fiscal year. The report attributed the declining performance to “increased ridership, lengthy construction delays, and unavoidable detours due to bridge closures.”
Overall, 79 of the 91 bus routes didn’t meet the 75% on-time goal and 27 were more than 10 percentage points below the standard. Newman said the agency will pay special attention to those routes to see what can be done to improve their efficiency.
“It’s something we have to continue to delve into,” she told the committee.
The P78 Oakmont Flyer, which travels through Harmar, Oakmont and Verona before getting on the Martin Luther King Jr. East Busway in Wilkinsburg to head Downtown, had the poorest on-time performance at 51%.
Ed covers transportation at the Pittsburgh Post-Gazette, but he's currently on strike. Email him at eblazina@unionprogress.com.


